About
Why is this study valuable now?
Background
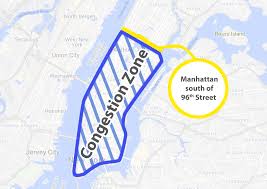
Congestion Surcharge
Motivation
Why it matters?

Objective
Our approach
Congestion Surcharge
Why it matters?
Our approach

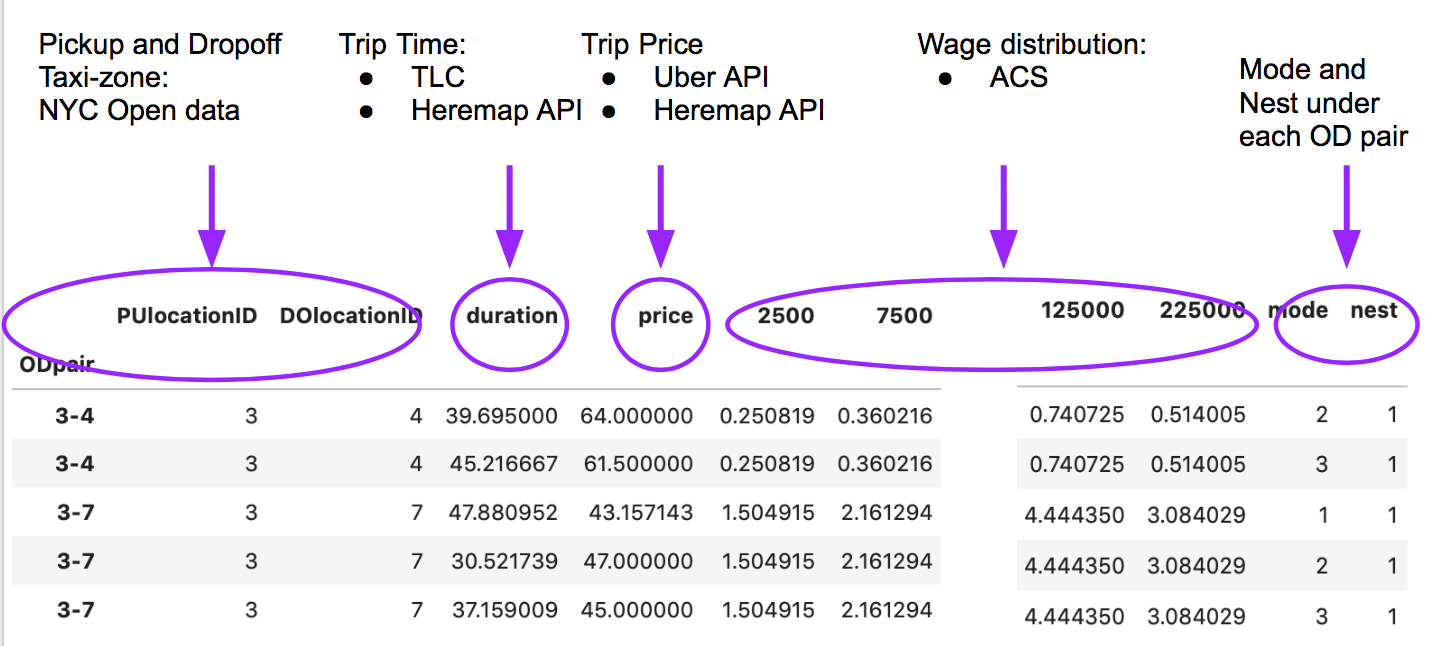 ——————Data Source——————
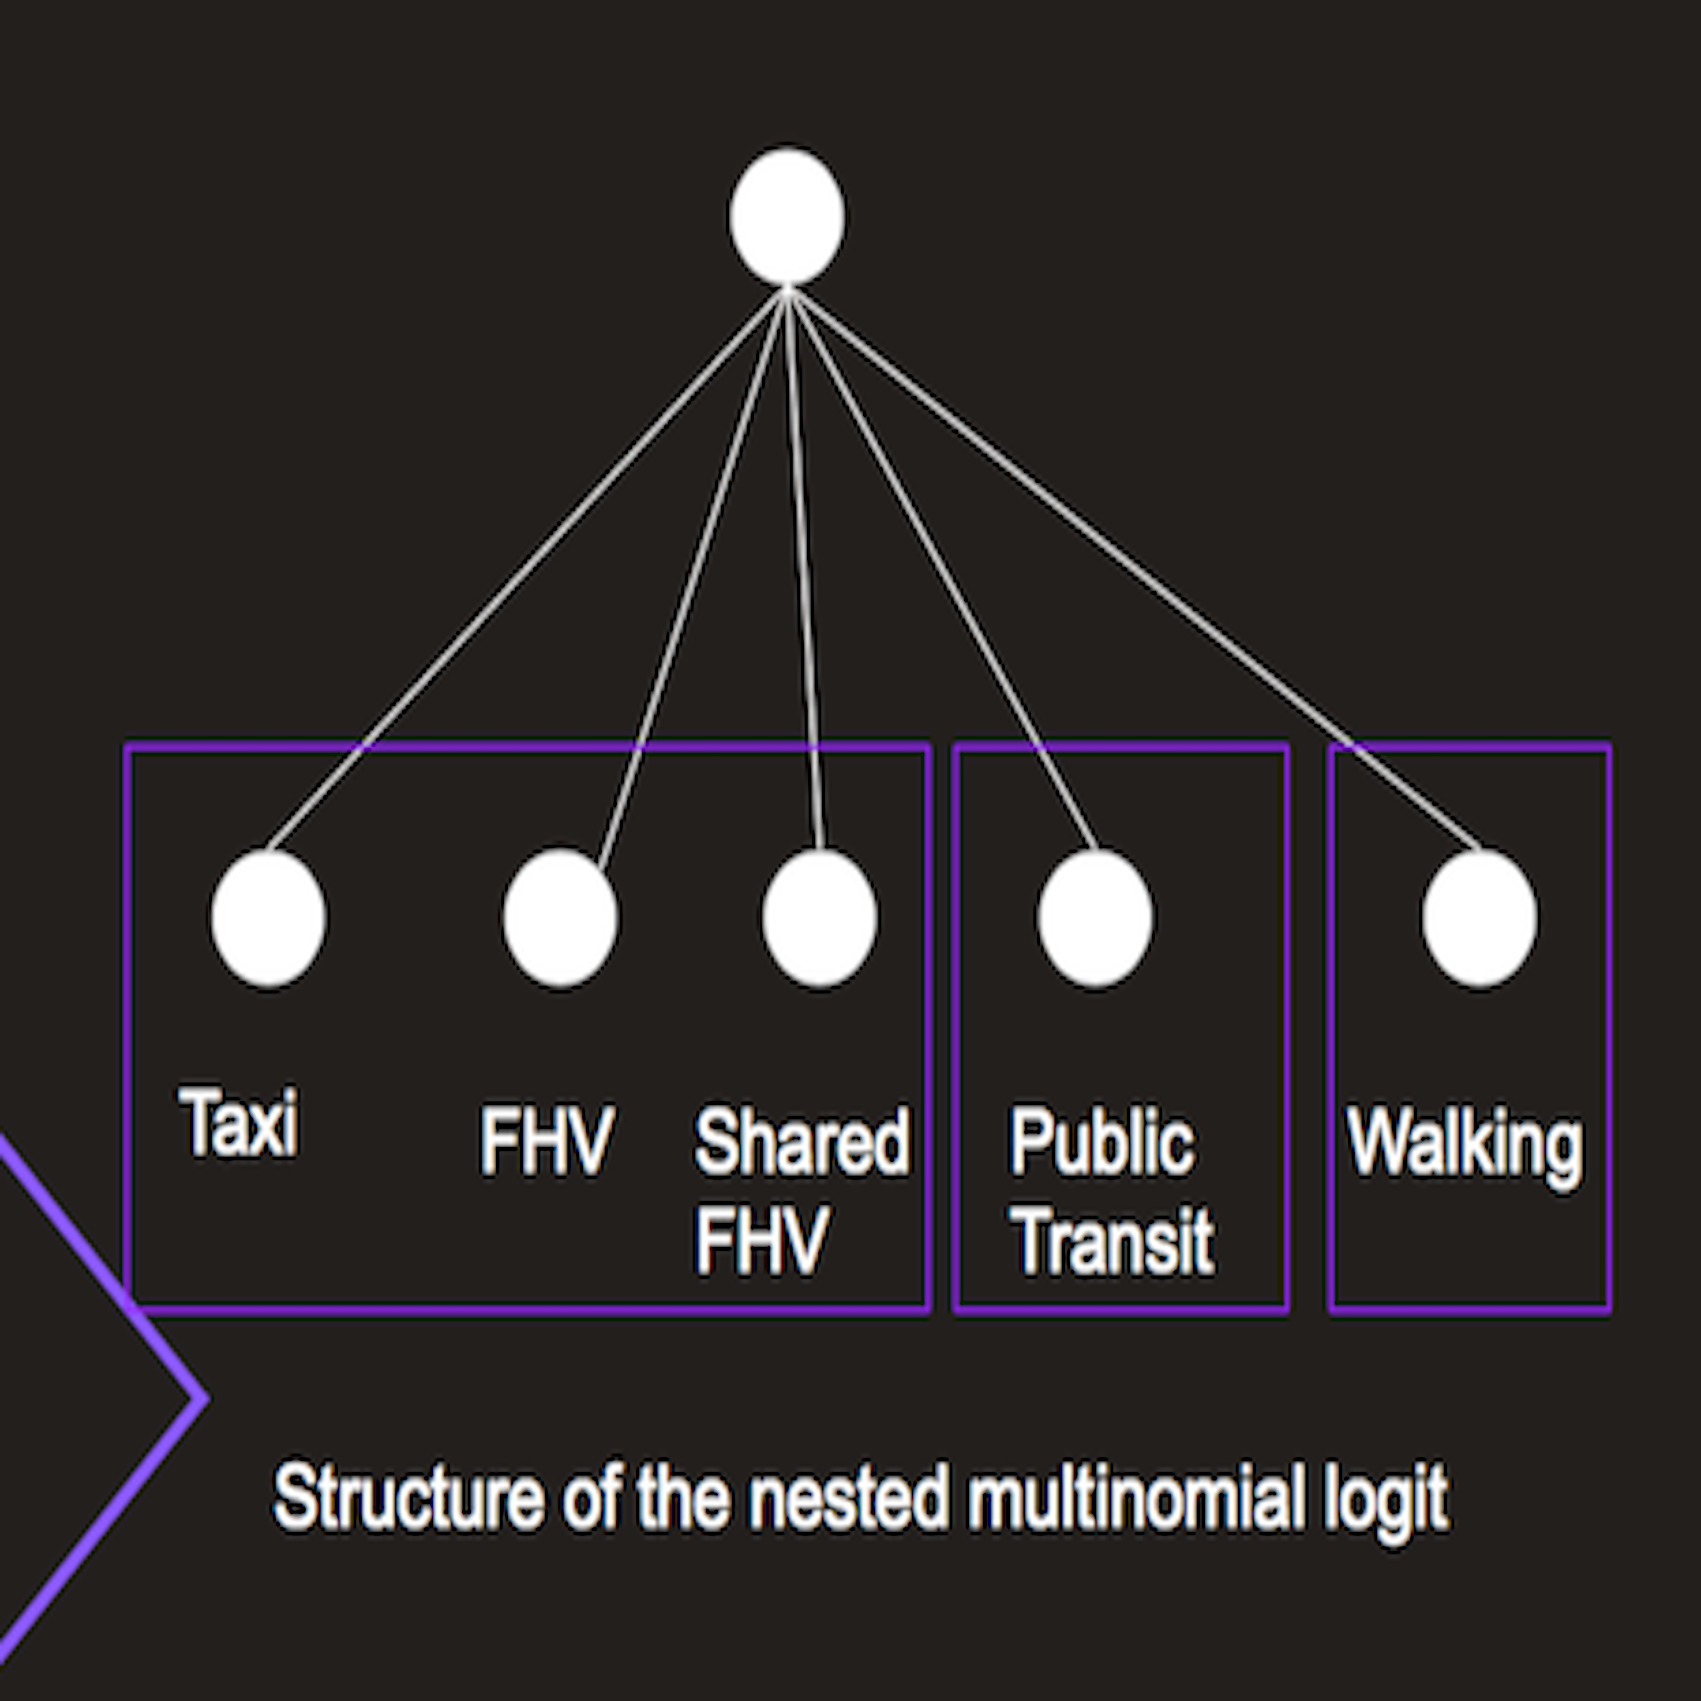
Nested Logit Models
In order to quantify the impact of the Manhattan Congestion Pricing policy, we have compared the simulated ridership under the new pricing scenario against the simulated baseline scenario. For that purpose, we have first used the LEHD/LODES as a proxy for urban mobility, then trained a nested multimonial logit model based on choices reported in ACS and actual proportions of taxi, FHV and shared FHV observed in the data, and finally compared the simulated ridership to the prior observed preferences to assess the predicted modal shifts under different scenaris.
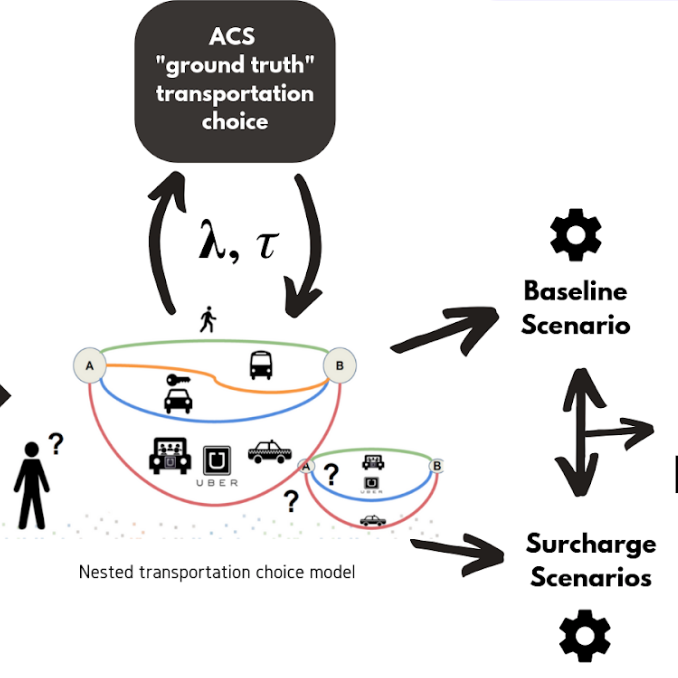
Choose the best parameters
Tune the parameters by comparing the model results with
ground choice. We use monte carlo in choosing parameters. Regrading sampling taxi zones,
we first try to randomly choose 10 taxi zones; then try to pick the taxi zones which
cover 60% population. Apply grid search to those sampling taxi zones. The loss function
that we tried include root of mean saqure error (RMSE), normalized RMSE, weighting cummulative loss,
and RMSE based on total population for each mode. Finally pick the best parameters from 48 combination
of Tao and Lambda. We also apply uncertatinty in our results.
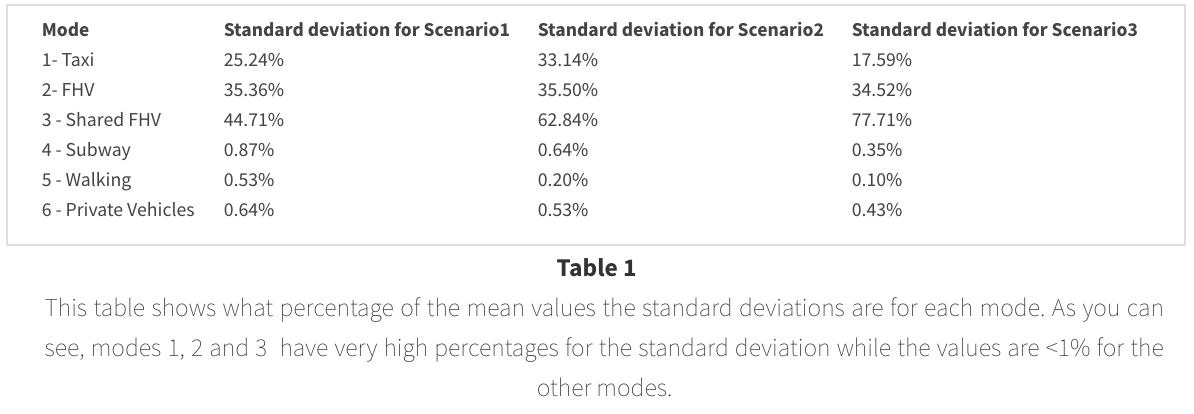
The below table shows the relative values of standard deviation for each mode
and scenario relative to the mean value so that we can get a better idea of what
sort of variation to expect from the model results.
Quantitatively evaluate THE impacts of Manhattan Congestion Pricing Policy basen on our transportation mode shift model of three scenarios:
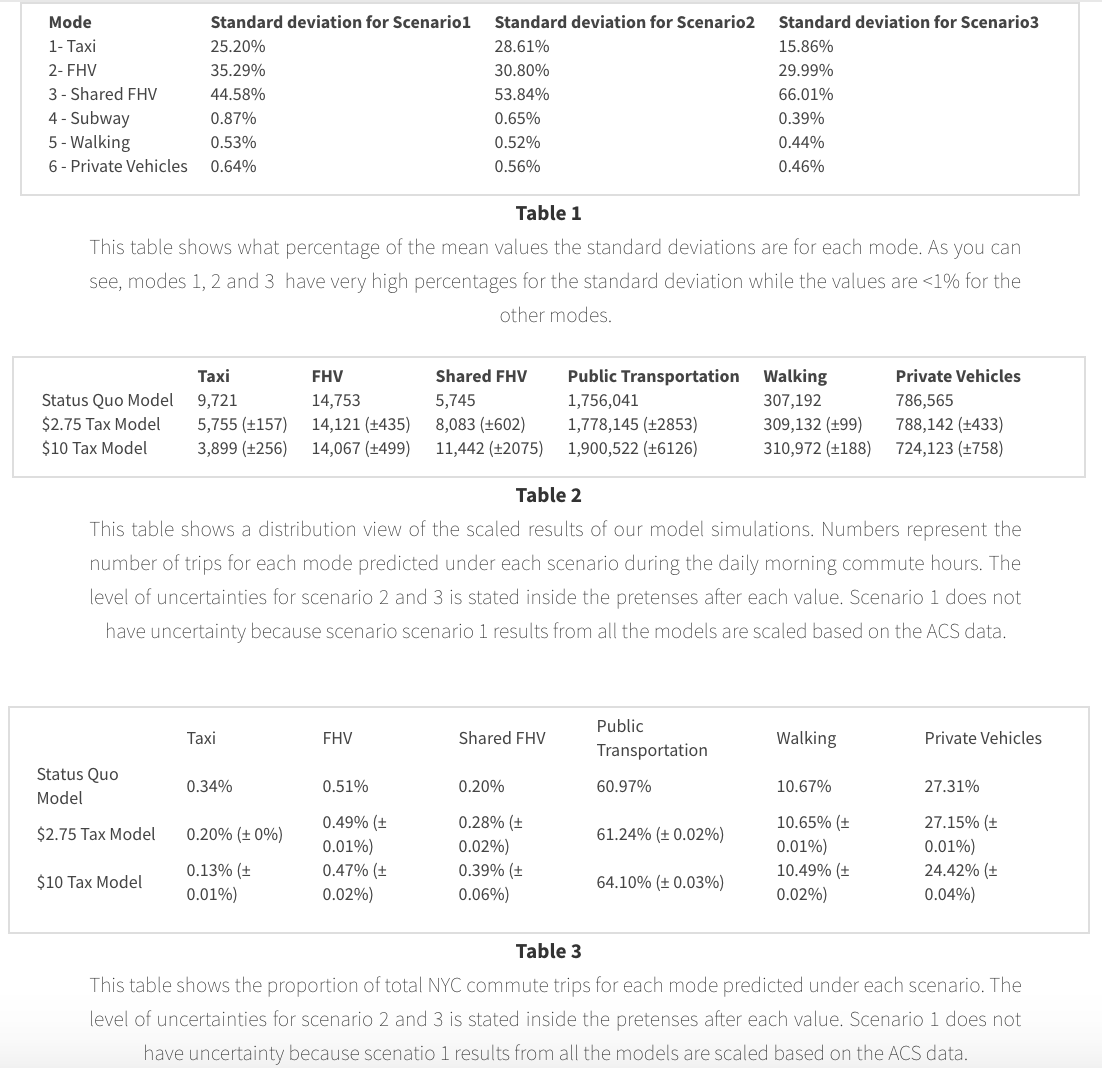
Table2 and Table 3 show the shift in NYC wide transportation choices projected
for each policy scenario. The weighted average of 5 sets of best
models are considered as the final results and the weighted standard deviates are calculated as
uncertainties of each value. The results are scaled based on the "ground truth" -
the commuting transportation mode choices reported in the American Community
Survey(ACS) to ensure they matched with the realities. Our model predicts a
reduction in Taxi, (non-shared) FHV, and private vehicle trips under both Congestion
Pricing Scenarios. We predicted an overall 0.16% drop (about 4,600 trips) in Taxi
and (non-shared) FHV trips during the daily morning commute hours under the $2.75 tax,
and an overall 0.25% drop (about 65,00 trips) under the $10 tax. The private vehicle
trips decrease 0.16% (about 1,500 trips) under the $2.75 tax and 2.89% (about 62,000
trips) under $10 tax. The model predicts an increase in Shared FHV trips, Public
Transportation trips, and Walking trips in both scenarios.
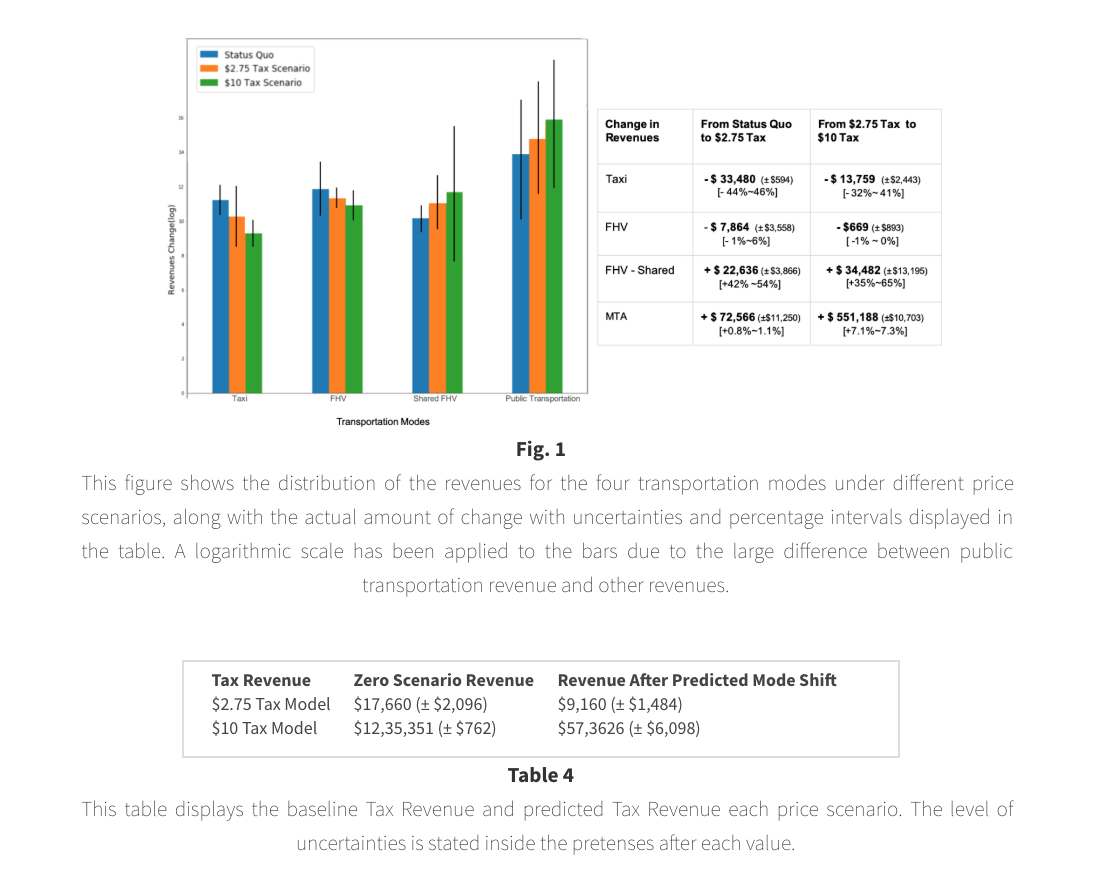
Our major results are reported in Figure 1. This bar chart on the left shows the change
in revenues with uncertainties for Public Transportation(MTA), Taxi, FHV, and Shared-FHV under
each price scenario. Corresponding to the mode shift, there are predicted a reduction in
Taxi and (non-shared) FHV revenues under both Congestion Pricing Scenarios, and an increase
in Shared- FHV and MTA revenues. The table on the right displays the actual amount of change
n dollars between scenarios with the corresponding percentage. Taxi revenue has the biggest
percentage drop (up to 46% decrease), and MTA has the greatest growth in number
(about $72,000 and $551,000). Non-shared FHV has a slight decrease in revenues under
each price scenario, however, the increase in shared FHV (up to 65% increase) can
easily cover that loses and creates extra profits for the total FHV revenue
(the overall FHV revenue increases $14,771 from status quo to $2.75 tax and
$33,818 from $2.75 to $10 tax). Table (4) shows the Tax Revenue from the
Congestion Surcharge under each scenario. We compare our predicted tax revenue
with a "zero scenario" revenue- the expected revenue if the surcharge were imposed
and no commuters change their mode choice behaviors. The results show that both of
the predicted revenues after the mode shift in scenario 2 and 3 are about 50% lower
than the zero scenario revenues. We believe that this shows the advantage of our
ethodology, as the use of a mode shift model provides a more realistic prediction
of future revenues, as it accounts for behavior changes resulting from the tax.
Policy makers using the zero scenario might vastly over-estimate surcharge tax
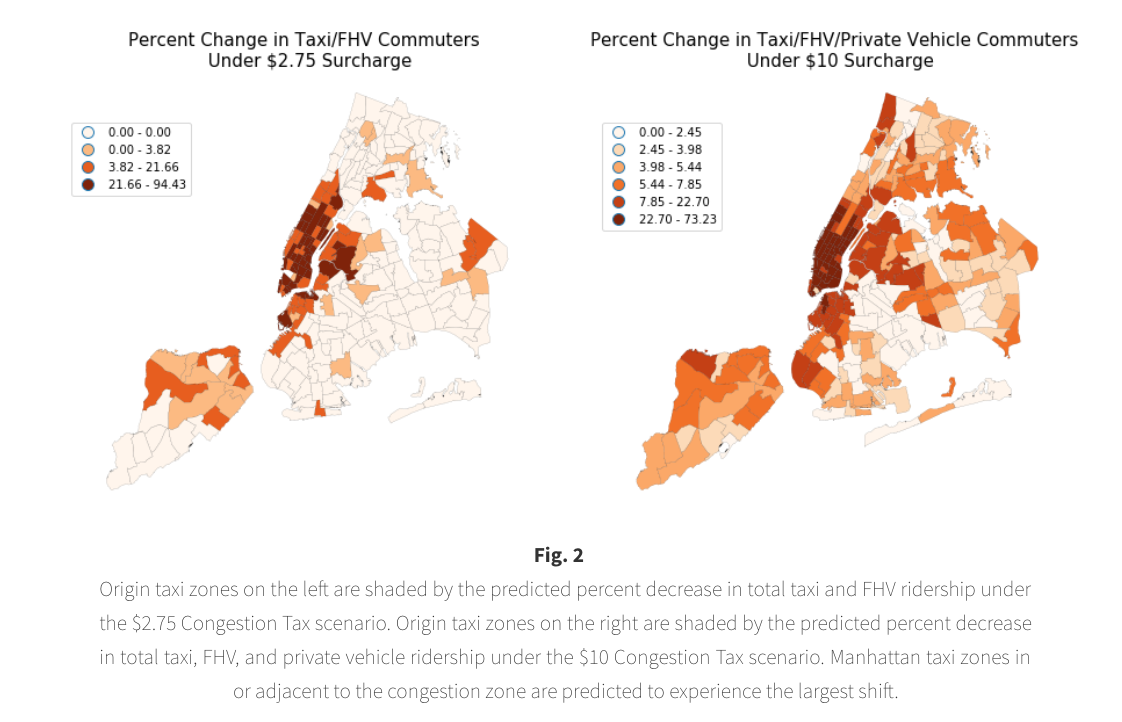
revenues. All of the 37 origin taxi zones that the model predicts will experience
the most mode shift under the $10 Congestion Tax (predicted change is more than
28.57%, which is one standard deviation above the mean predicted change) are
in Manhattan. As seen in Figure 2, the geographic range of impact is much
larger in Scenario 3 ($10 surcharge). Our model did not assume any exemptions
for residents of the congestion zones, and our results suggest that decisions
around those exemptions may significantly affect the impacts of the policy.
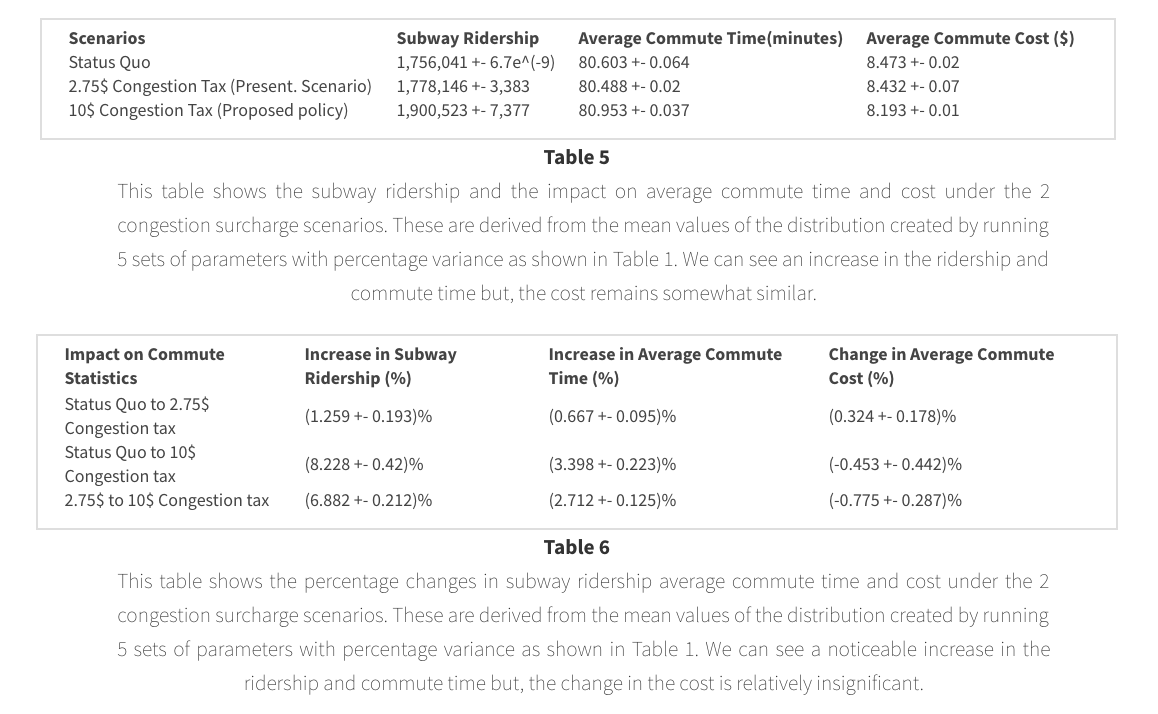
As seen in Tables 5 and 6, the subway ridership and the commute time increased
for both the scenarios but, the change is more significant for the $10 Congestion Tax
Scenario. So, we can see that the average commuter will spend not only more time on their
commute but will also, most likely, have to commute in more crowded subway cars. Also,
an interesting impact seen here is that the commute cost increases slightly in the $2.75
congestion tax scenario in contrast to it reducing in the $10 scenario. This is because
the model predicted that most of the taxi and FHV commuters simply switched to either
shared FHVs or stuck to their mode of choice and just paid the surcharge instead of
shifting to the subway which dramatically cut the cost which makes sense too as people
are usually very reluctant to change their transportation mode.
.
The earlier cited work of Gibson, et. al provides a framework for us to quantitatively evaluate the predicted environmental impacts of the surcharge scenarios. They found that for every daily vehicle reduction emissions would be reduced by .00006552 microgram/meter cubed. They then presented a framework for quantifying the economic benefit of this emissions reduction. They cite 1984 US government research that estimated that people were willing to pay $148.70 ($366.59 in 2019) per year per person for every microgram/cubic meter reduction in pollution. If we assume that every 60 miles (during the 6 am to 10 am morning commute window) in driving distance represents one vehicle (conservatively assuming a constant 15 miles per hour), we can estimate the number of vehicles reduced. From this framework we predict a very small reduction of 29 (+-15) cars per commute window under the $2.75 surcharge scenario and a reduction of 9,060 (+- 40) cars during the morning commute under the $10 scenario. This includes total mileage reduction from taxis, FHVs and private vehicles and accounts for the additional miles from the predicted increase in shared FHVs. Under scenario 2 we would approximate a negligible daily reduction of pollutants by .002 (+-.001) micrograms/meters cubed, for a yearly reduction of 0.7 (+- 0.35) attributed to the effect of the $2.75 surcharge on the morning commuter. Under scenario 3 the framework presented by Gibson, et.al would predict a daily reduction of approximately 0.6 (+-.003) micrograms/meters cubed for a 217 (+-1) microgram/meters cubed yearly reduction of harmful pollutants attributed to the morning commute hours. If we multiply that total by the $366.59 per year a person is willing to pay for a reduction in unit of pollutants, we get a yearly value of $79,430 (+-$353) per person impacted. Applied to the approximately 1.3 million people living in Manhattan's congestion zone, the reductions environmental benefits are significant. Notable from Gibson, et. al. was the finding that air quality benefits expanded beyond the congestion zone, suggesting an even larger range of environmental benefit is possible.
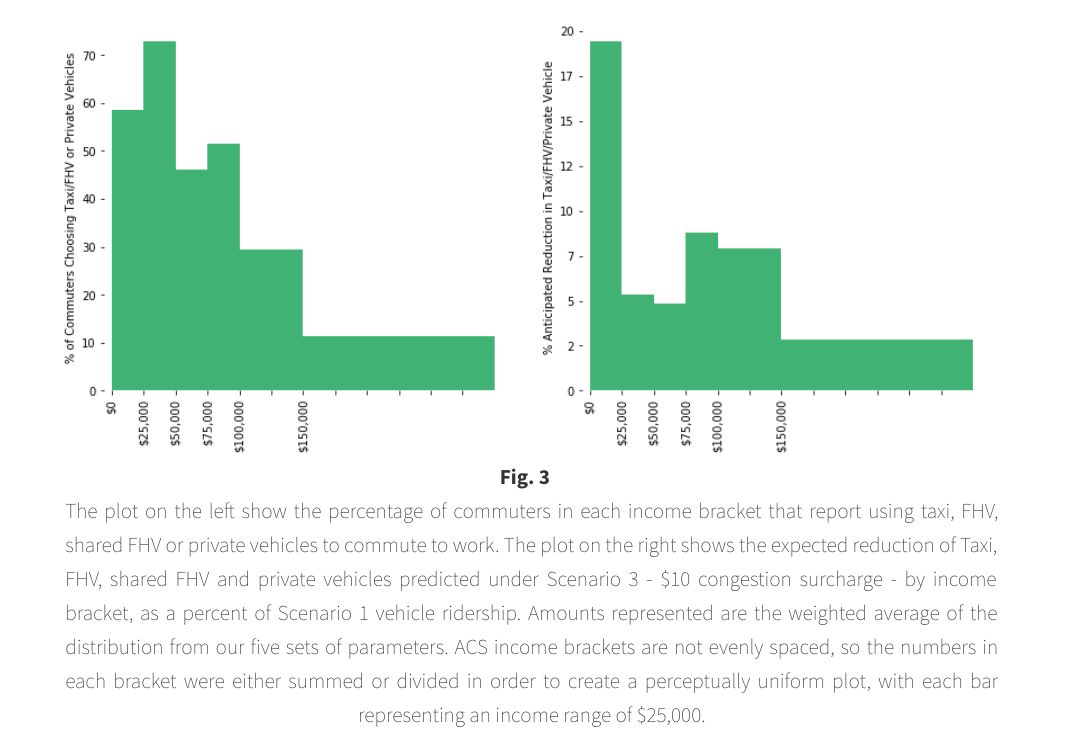
In order to evaluate any potential equity or accessibility concerns with the existing
or proposed congestion tax, we compared our model's predicted mode shift segmented by wage
bracket. Figure 3 plots the predicted percentage reduction (right) in vehicle commutes from
the baseline Scenario 1 to Scenario 3 - the proposed $10 surcharge - by income bracket, as
well as the original percent of commuters in each bracket who choose taxi/FHV/private vehicle
(left). Many vehicle-based commuters make fewer than $100,000 per year, suggesting potential
for a congestion surcharge to weigh heavily on lower and middle income commuters. When
plotting predicted mode shift as a result of the surcharge, it becomes clear that of all
vehicle commuters, those making under $25,000 may feel the most impact in terms of mode
shift as a percentage of vehicle commuters.
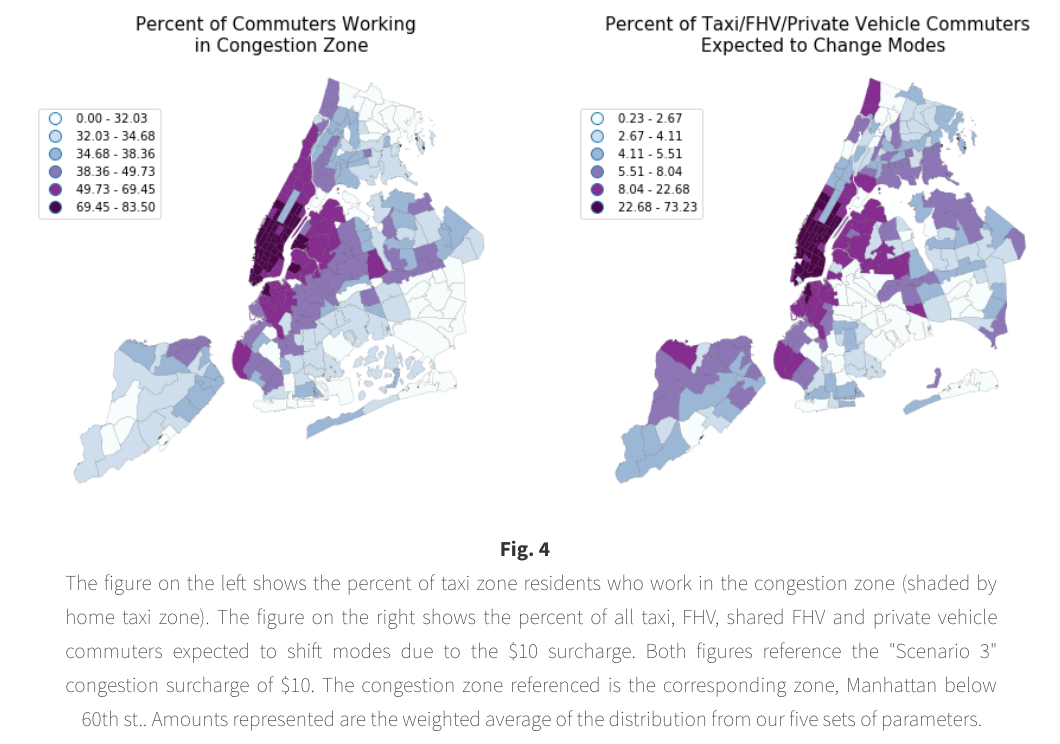
A higher percent of commuters working in the congestion zone is associated with a
higher percent of vehicle commuters predicted to change modes. This makes sense as commuters
not living or working in the congestion zone will not be affected by the surcharge during their
workday commutes.
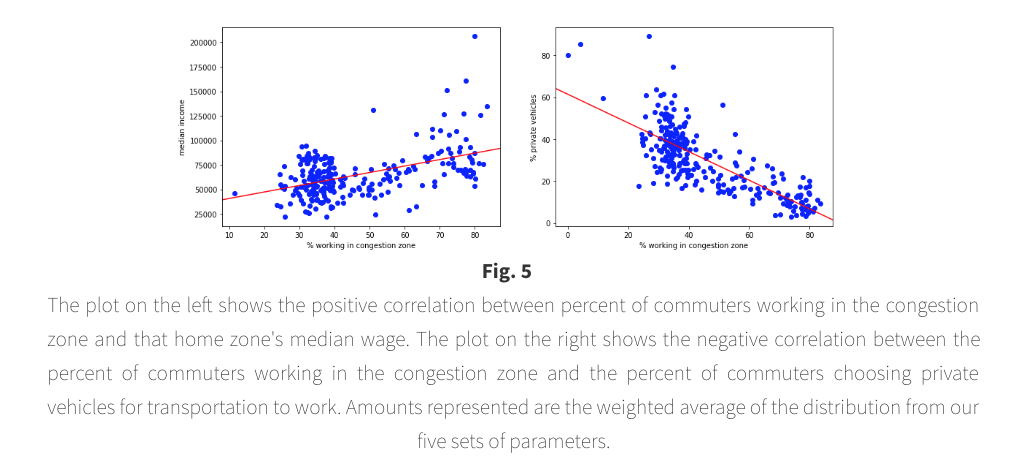
As seen in Figure 5, the percent of people working in the congestions
zone is associated with a higher median income at the taxi zone level. Additionally,
the percent of people working in the congestion zone is associated with a lower percentage
of people in that zone reporting private vehicles as their transportation choice, suggesting
that many private vehicle commuters may not work in the congestion zone, and may not be
impacted by the surcharge on their daily commutes. Referring again to Figure 3 those
lower income commuters who do work in the congestion are predicted to shift modes at a
higher rate, potentially creating a prohibitively long commute.
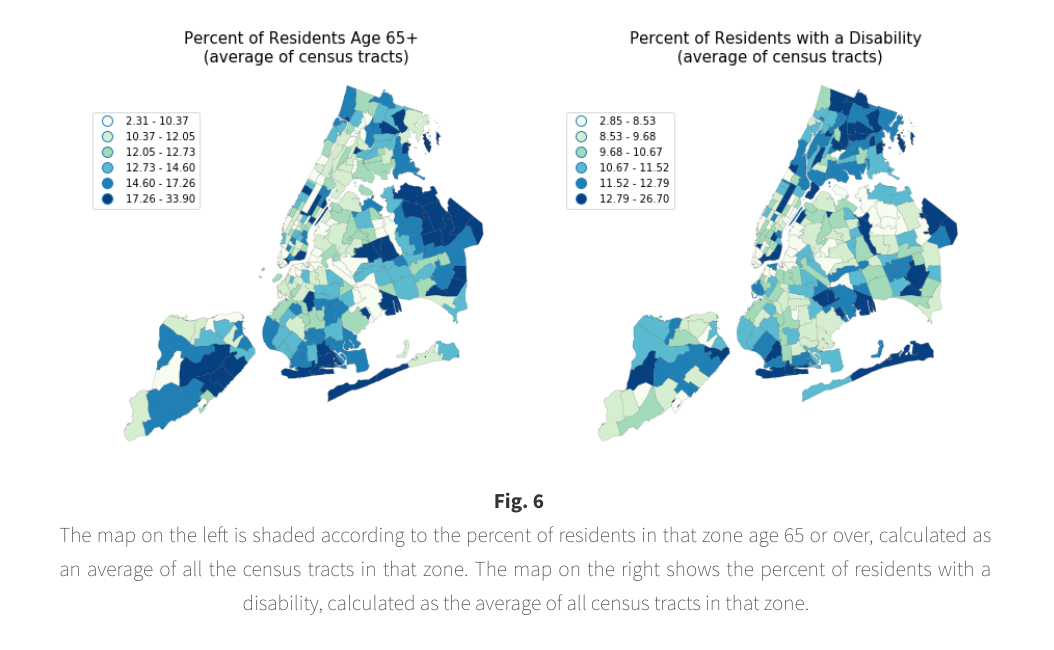
To explore accessibility concerns, Figure 6 has been included to show the distribution
of residents over the age of 65 or with a disability. While our model estimates mode choice
based on a trade off between time and cost, these populations may have additional concerns
that might prevent them from switching modes, particularly to public transportation, even
if a surcharge made their vehicle-based commute prohibitively expensive. While the final
details of the proposed $10 surcharge are not yet available, most news accounts report that
there will be an exemption or discount for populations with accessibility concerns,
particularly for those living in the congestion zone.
Github: Manhattan-Congestion-Surcharge-Capstone
Paper: Impact of Manhattan Congestion Surcharge on For-Hire Vehicles

Project Mentor

Literature Review
& Report Writing Lead

Modeling and Analysis Lead
& Web Development

Modeling and Analysis Lead

Data Lead

Data Lead
BE THE BEST TEAM!